Market Outlook
December 13, 2017
Market Cues
Domestic Indices
Chg (%)
(Pts)
(Close)
Indian markets are likely to open flat tracking global indices and SGX Nifty.
BSE Sensex
(0.7)
(228)
33,228
US markets may show a lack of direction in early trading on Tuesday following the
Nifty
(0.8)
(82)
10,240
modest strength seen in the previous session. The major index futures are currently
Mid Cap
(1.0)
(173)
16,933
pointing to a mixed open for the markets, with the Dow futures up by 52 points and
Small Cap
(0.7)
(124)
18,128
the Nasdaq futures down by 4 points.
Bankex
(1.0)
(294)
28,458
The European markets got off to a rough start Tuesday, but ended the session with
modest gains. Traders are in a cautious mood ahead of the upcoming flurry of
Global Indices
Chg (%)
(Pts)
(Close)
central bank activity this week.
Dow Jones
0.5
119
24,505
Indian markets fell modestly on Tuesday after three days of strong gains and amid
Nasdaq
(0.2)
(13)
6,862
macro data on inflation and industrial output due later in the day.
FTSE
0.6
47
7,500
While a rise in crude prices rekindled inflation worries, global cues also remained
Nikkei
(0.3)
(73)
22,866
muted ahead of key central bank meetings due this week as well as a major annual
Hang Seng
(0.6)
(171)
28,794
economic planning conference in Beijing that will set policy priorities for the next 12
Shanghai Com
(1.2)
(41)
3,281
months.
News Analysis
Advances / Declines
BSE
NSE
CPI inflation surprises on the upside as IIP remains tepid
Advances
952
923
Detailed analysis on Pg2
Declines
1,752
847
Unchanged
141
58
Investor’s Ready Reckoner
Key Domestic & Global Indicators
Volumes (` Cr)
Stock Watch: Latest investment recommendations on 150+ stocks
BSE
4,888
Refer Pg5 onwards
NSE
26,986
Top Picks
CMP
Target
Upside
Company
Sector
Rating
Net Inflows (` Cr)
Net
Mtd
Ytd
(`)
(`)
(%)
Blue Star
Capital Goods Accumulate
803
867
8.0
FII
44
(3,442)
54,190
Dewan Housing Finance
Financials
Buy
582
712
22.3
MFs
864
4,436 1,11,927
Asian Granito
Other
Accumulate
513
570
11.2
Navkar Corporation
Other
Buy
191
265
38.7
Top Gainers
Price (`)
Chg (%)
KEI Industries
Capital Goods Accumulate
394
436
10.8
Aban
206
7.6
More Top Picks on Pg4
Ipcalab
552
3.6
Key Upcoming Events
Mindtree
564
3.5
Previous
Consensus
Date
Region
Event Description
Reading
Expectations
Bluedart
4,650
3.5
Dec13
UK
Jobless claims change
1.10
Gruh
517
3.0
Dec13
US
Consumer price index (mom)
0.10
0.40
Dec14
China
Industrial Production (YoY)
6.20
Top Losers
Price (`)
Chg (%)
Dec14
India
Monthly Wholesale Prices YoY%
3.59
Fortis
128
(7.8)
Dec14
UK
BOE Announces rates
0.50
0.50
More Events on Pg7
Den
105
(5.2)
Videoind
18
(4.9)
Unitech
8
(4.6)
Deltacorp
246
(4.3)
As on December 12 2017
Market Outlook
December 13, 2017
News Analysis
CPI inflation surprises on the upside as IIP remains tepid
The CPI inflation for the month of November came in sharply higher touching a
15-month high at 4.88% even as the IIP for October came in tepid at just about
2.2%. The CPI inflation was just about 3.58% in the previous month. This inflation
level is also sharply higher than the RBI prescribed comfort level of 4% as a long-
term average. The RBI had already warned about the sharp increase in inflation in
its monetary policy in the aftermath of the higher HRA payable to government
employees. The real surge in inflation came in rural inflation which sharply moved
up from 3.36% to 4.79%. This is likely to force the MPC to put off rate cuts for the
time being.
There was some solace on the IIP front. The mining sector showed a growth of
0.2% and manufacturing showed a growth of 2.5% while electricity was up by
3.2%. A total of 10 out of the 23 industries in the manufacturing space saw
positive growth while the others registered negative growth. The combination of
higher inflation and flat growth almost rules out any rate cut by the RBI in the next
couple of monetary policies.
Economic and Political News
NHAI to speed up highway projects, to bid out 3,500 km of work by month-
end
Indian telecom subscriber base declines to 1.2 bn in October: Trai data
India's cotton output set to rise 9% in FY18 but fall short of record high
Corporate News
IndiGo promoters offloading `1,245cr shares through OFS
BHEL commissions 54-Mw coal-fired power plant in Indonesia
Apollo Munich sees FY18 premium collection growing 30% to `1,700cr
Market Outlook
December 13, 2017
Top Picks HHHHH
Market Cap
CMP
Target
Upside
Company
Rationale
(` Cr)
(`)
(`)
(%)
Strong growth in domestic business due to its leade`hip
in acute therapeutic segment. Alkem expects to launch
Alkem Laboratories
25,002
2,091
2,341
12.0
more products in USA, which bodes for its international
business.
We expect the company would report strong profitability
Asian Granito
1,542
513
570
11.2
owing to better product mix, higher B2C sales and
amalgamation synergy.
Favorable outlook for the AC industry to augur well for
Cooling products business which is out pacing the
Blue Star
7,695
803
867
8.0
market growth. EMPPAC division's profitability to
improve once operating environment turns around.
With a focus on the low and medium income (LMI)
consumer segment, the company has increased its
Dewan Housing Finance
18,253
582
712
22.3
presence in tier-II & III cities where the growth
opportunity is immense.
Loan growth is likely to pick up after a sluggish FY17.
Lower credit cost will help in strong bottom-line growth.
Karur Vysya Bank
8,403
116
180
54.6
Increasing share of CASA will help in NIM
improvement.
High order book execution in EPC segment, rising B2C
KEI Industries
3,084
394
436
10.8
sales and higher exports to boost the revenues and
profitability
Expected to benefit from the lower capex requirement
Music Broadcast
2,196
385
434
12.7
and 15 year long radio broadcast licensing.
Massive capacity expansion along with rail advantage
Navkar Corporation
2,876
191
265
38.7
at ICD as well CFS augur well for the company
Strong brands and distribution network would boost
Siyaram Silk Mills
3,518
751
800
6.6
growth going ahead. Stock currently trades at an
inexpensive valuation.
Market leadership in Hindi news genre and no.
2
viewership ranking in English news genre, exit from the
TV Today Network
2,364
396
435
9.8
radio business, and anticipated growth in ad spends by
corporate to benefit the stock.
After GST, the company is expected to see higher
volumes along with improving product mix. The Gujarat
Maruti Suzuki
2,76,184
9,143
9,674
5.8
plant will also enable higher operating leverage which
will be margin accretive.
We expect loan book to grow at 24.3% over next two
GIC Housing
2,204
409
655
60.0
year; change in borrowing mix will help in NIM
improvement
We expect CPIL to report net Revenue/PAT CAGR of
~17%/16% over FY2017-20E mainly due to healthy
7,419
334
400
19.8
growth in plywood & lamination business, forayed into
Century Plyboards India
MDF & Particle boards on back of strong brand &
distribution network.
We expect sales/PAT to grow at 13.5%/20% over next
LT Foods
2,190
82
96
16.9
two years on the back of strong distribution network &
addition of new products in portfolio.
Source: Company, Angel Research
Market Outlook
December 13, 2017
Key Upcoming Events
Global economic events release calendar
Bl oomberg Data
D ate
Time
C ountry
Event Description
Unit
Period
L ast Reporte d
E stimate d
Dec 13, 2017
3:00 PM UK
Joble ss claims change
% Change
Nov
1.10
7:00 PM US
Consumer price index (mom)
% Change
Nov
0.10
0.40
Dec 14, 2017
7:30 AM China
Industrial Production (YoY)
% Change
Nov
6.20
12: 00 PM India
Monthly Wholesale Prices YoY%
% Change
Nov
3.59
5:30 PM UK
BOE Announce s rate s
% Ratio
Dec 14
0.50
0.50
6:15 PM Euro Zone ECB announces interest rates
%
Dec 14
-
7:45 PM US
Industrial Production
%
Nov
0.94
Dec 15, 2017
3:30 PM Euro Zone Euro-Zone CPI (YoY)
%
Nov F
1.40
Dec 18, 2017
12: 30 AM US
FOMC rate decision
%
Dec 13
1.25
1.50
Dec 19, 2017
7:00 PM US
Housi ng Starts
Thousands
Nov
1,290.00
7:00 PM US
Building permits
Thousands
Nov
1,316.00
Dec 20, 2017
8:30 PM US
Existing home sales
Million
Nov
5.48
Dec 22, 2017
8:30 PM US
New home sales
Thousands
Nov
685.00
3:00 PM UK
GDP (YoY)
% Change
3Q F
1.50
Dec 27, 2017
8:30 PM US
Consumer Confidence
S.A./ 1985=100
Dec
129.50
Feb 14, 2018
12: 30 PM Germany GDP nsa (YoY)
% Change
4Q P
2.30
Source: Bloomberg, Angel Research
Market Outlook
December 13, 2017
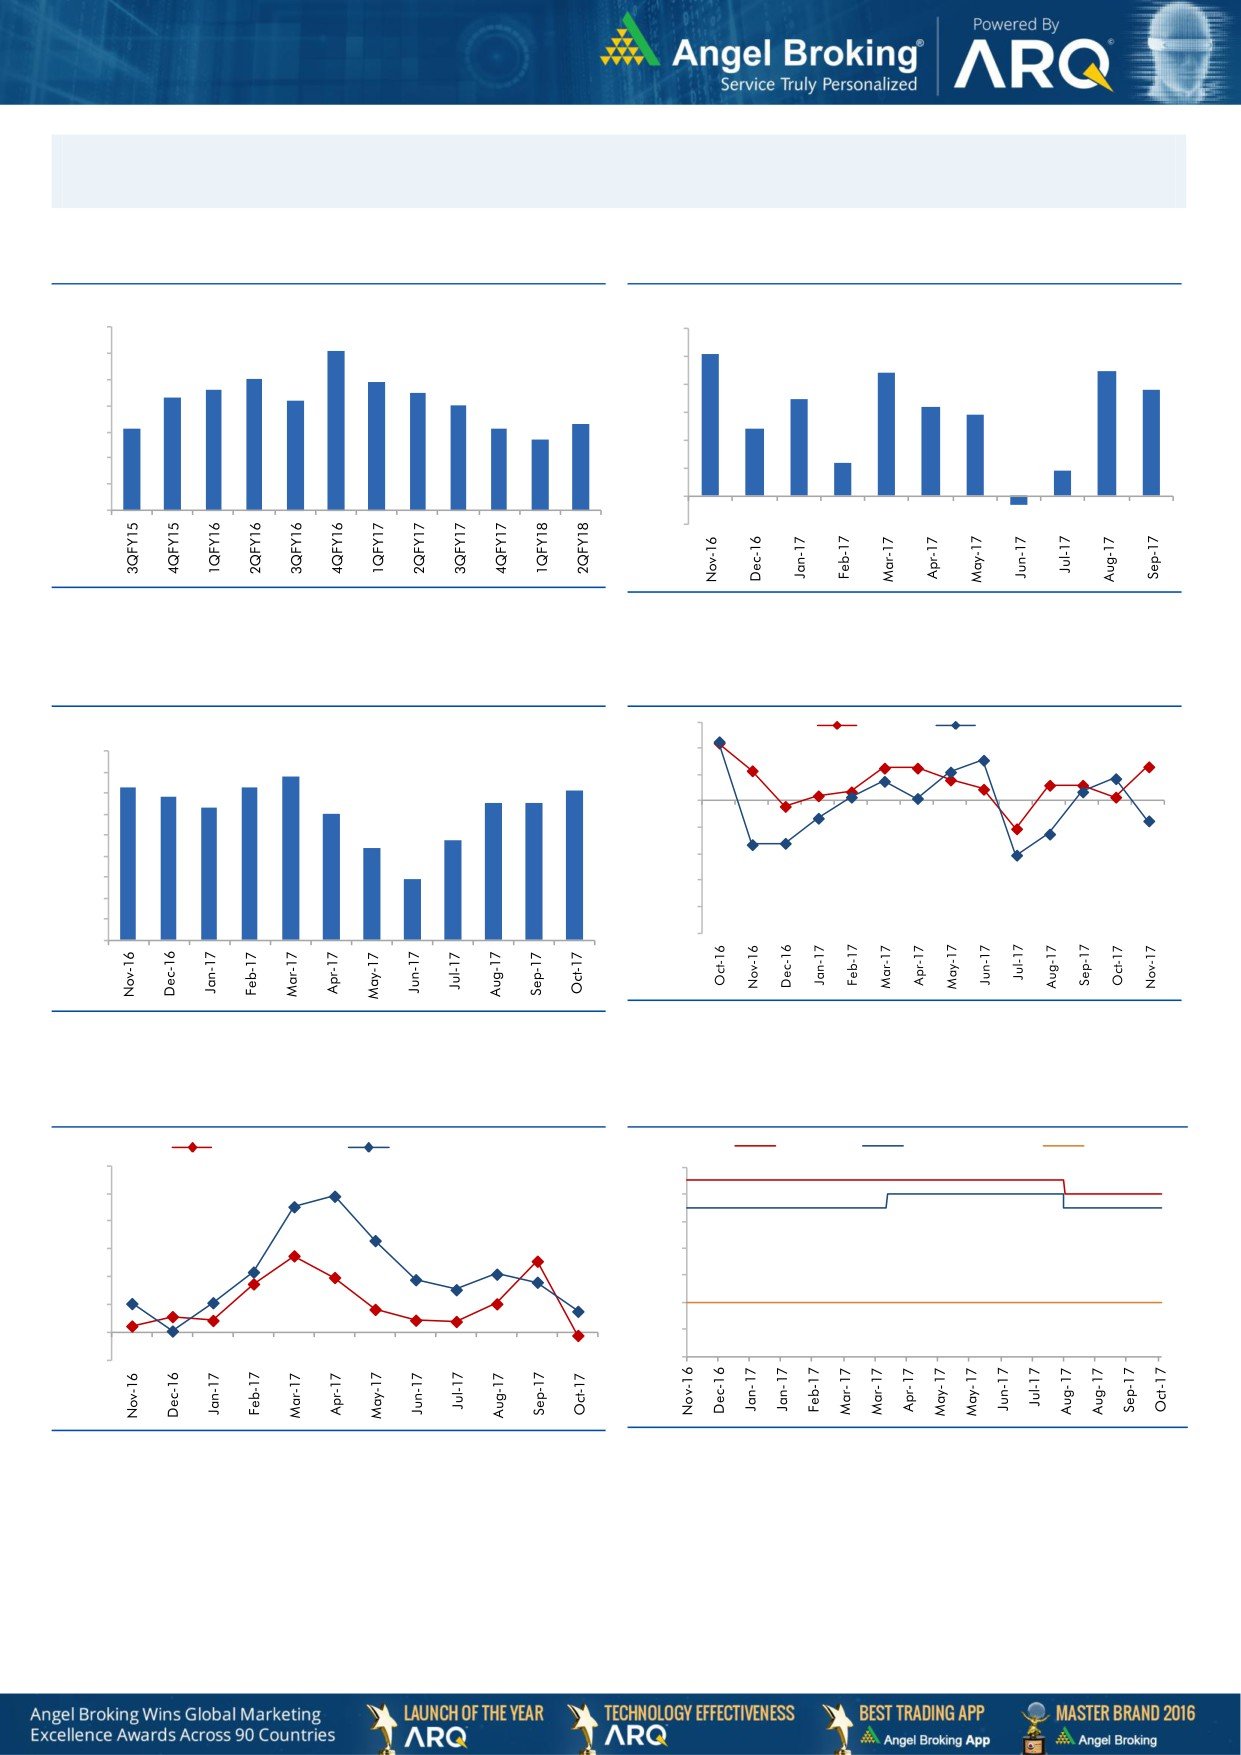
Macro watch
Exhibit 1: Quarterly GDP trends
Exhibit 2: IIP trends
(%)
(%)
10.0
6.0
9.1
5.1
9.0
5.0
4.4
4.5
8.0
7.9
7.6
7.5
3.8
8.0
7.3
7.2
4.0
3.5
7.0
3.2
2.9
7.0
6.3
6.1
6.1
3.0
2.4
5.7
6.0
2.0
1.2
5.0
0.9
1.0
4.0
-
3.0
(1.0)
(0.3)
Source: CSO, Angel Research
Source: MOSPI, Angel Research
Exhibit 3: Monthly CPI inflation trends
Exhibit 4: Manufacturing and services PMI
56.0
Mfg. PMI
Services PMI
(%)
4.5
54.0
3.9
4.0
3.6
3.7
3.6
52.0
3.4
3.2
3.3
3.3
3.5
3.0
50.0
3.0
2.4
48.0
2.5
2.2
2.0
46.0
1.5
1.5
44.0
1.0
42.0
0.5
40.0
-
Source: Market, Angel Research; Note: Level above 50 indicates expansion
Source: MOSPI, Angel Research
Exhibit 5: Exports and imports growth trends
Exhibit 6: Key policy rates
(%)
Exports yoy growth
Imports yoy growth
(%)
Repo rate
Reverse Repo rate
CRR
60.0
6.50
50.0
6.00
40.0
5.50
30.0
5.00
20.0
4.50
10.0
4.00
0.0
3.50
(10.0)
3.00
Source: Bloomberg, Angel Research
Source: RBI, Angel Research
Market Outlook
December 13, 2017
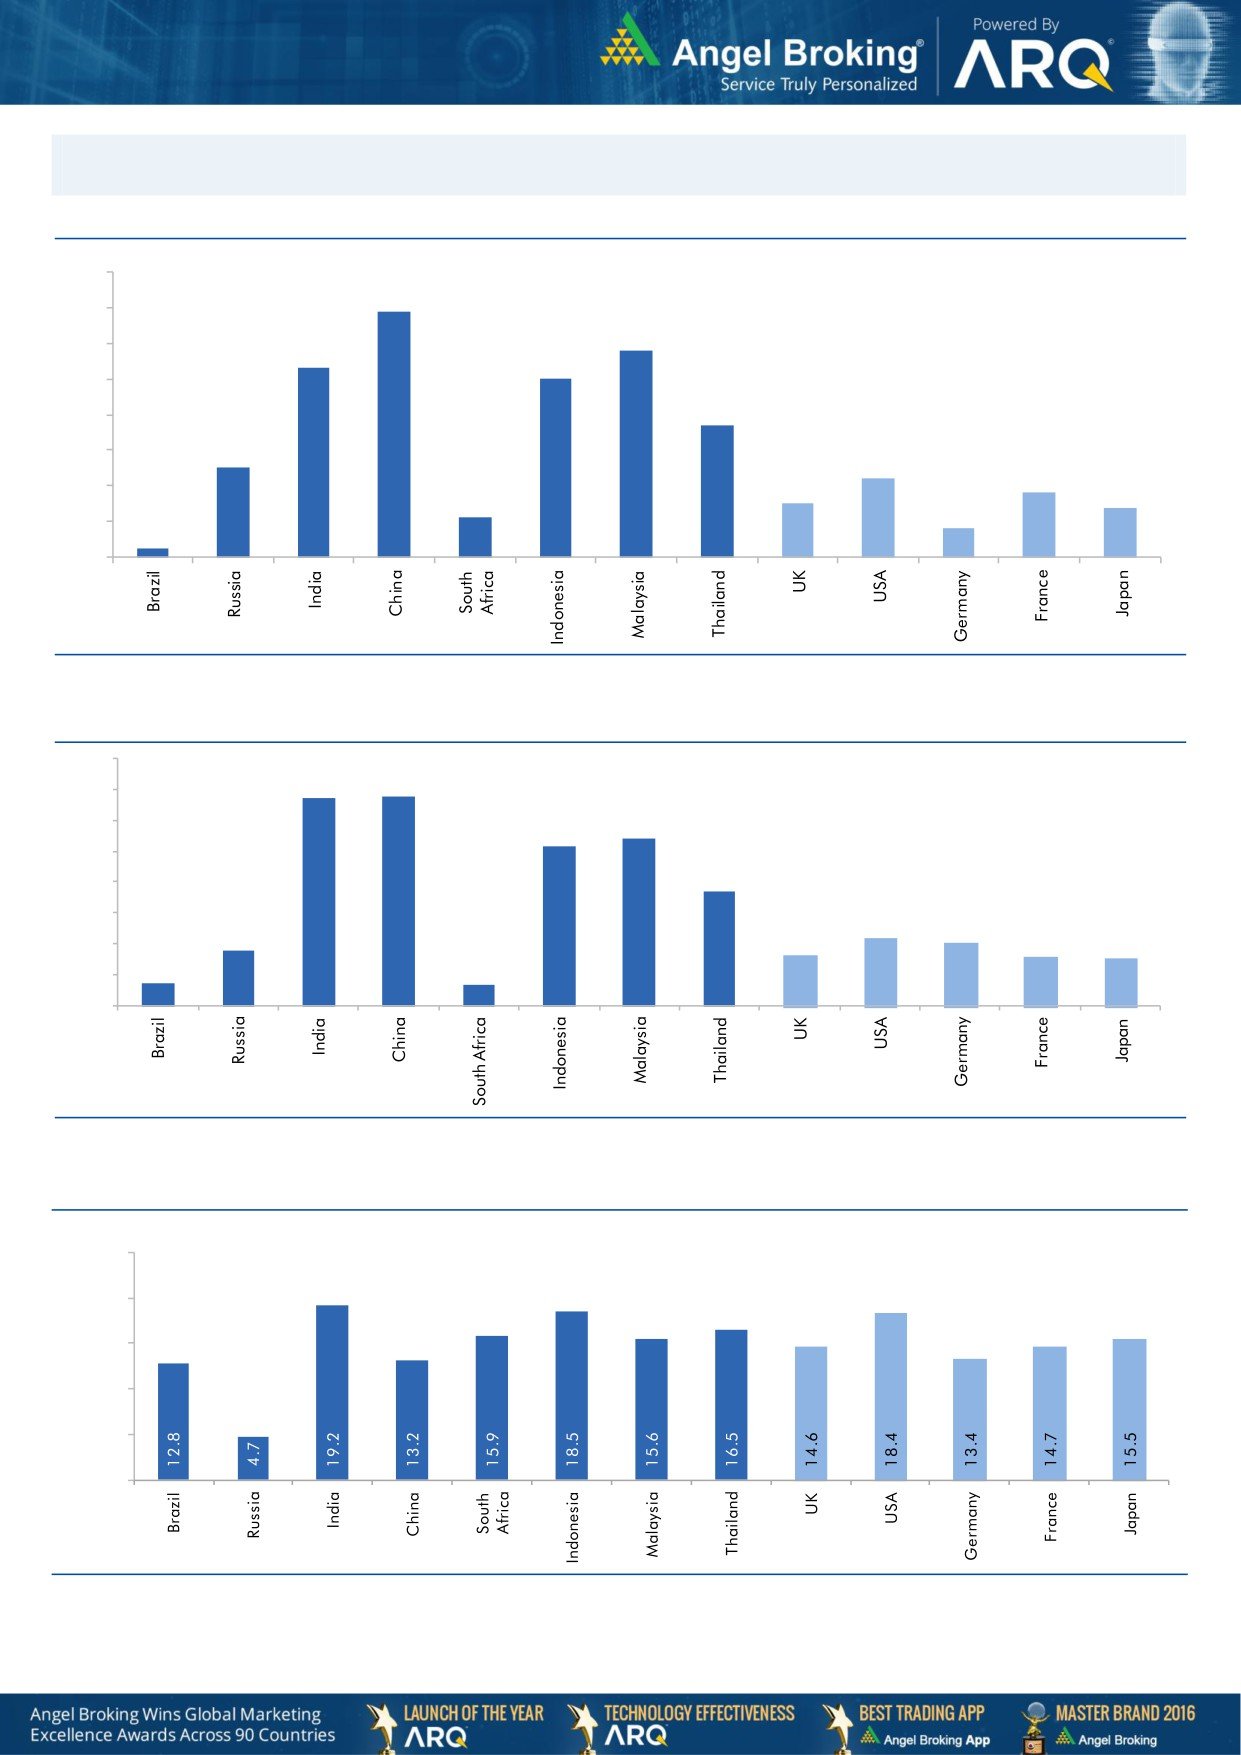
Global watch
Exhibit 1: Latest quarterly GDP Growth (%, yoy) across select developing and developed countries
(%)
8.0
6.9
7.0
5.8
6.0
5.3
5.0
5.0
1.1
3.7
4.0
2.5
3.0
2.2
1.8
2.0
1.5
1.4
0.8
1.0
0.3
-
Source: Bloomberg, Angel Research
Exhibit 2: 2017 GDP Growth projection by IMF (%, yoy) across select developing and developed countries
(%)
6.7
6.8
7.0
6.0
5.4
5.2
5.0
3.7
4.0
3.0
1.8
2.2
2.0
1.7
1.6
2.0
0.7
1.5
0.7
1.0
-
Source: IMF, Angel Research
Exhibit 3: One year forward P-E ratio across select developing and developed countries
(x)
25.0
20.0
15.0
10.0
5.0
-
Source: IMF, Angel Research
Stock Watch
December 13, 2017
Company Name
Reco
CMP
Target
Mkt Cap
Sales ( Čcr )
OPM(%)
EPS (Č)
PER(x)
P/BV(x)
RoE(%)
EV/Sales(x)
(Č)
Price ( Č)
( Č cr )
FY18E FY19E
FY18E
FY19E
FY18E
FY19E
FY18E
FY19E
FY18E
FY19E
FY18E
FY19E
FY18E
FY19E
Agri / Agri Chemical
Rallis
Reduce
235
209
4,570
1,873
2,099
15.0
15.0
9.5
10.5
24.7
22.4
3.8
3.4
15.8
16.0
2.3
2.1
United Phosphorus
Accumulate
730
820
37,100
18,922
21,949
18.0
18.5
36.2
45.6
20.2
16.0
4.2
3.5
22.7
23.8
2.1
1.8
Auto & Auto Ancillary
Ashok Leyland
Accumulate
114
127
33,325
23,339
27,240
10.1
10.8
4.7
6.2
24.5
18.3
4.9
4.3
20.0
23.6
1.4
1.2
Bajaj Auto
Neutral
3,169
-
91,690
23,936
27,955
19.5
20.1
142.7
167.3
22.2
18.9
4.8
4.3
21.8
22.8
3.4
2.9
Bharat Forge
Buy
697
875
32,470
7,637
8,755
21.7
23.2
36.1
47.3
19.3
14.8
3.5
3.0
18.5
20.8
4.1
3.5
Eicher Motors
Neutral
28,599
-
77,893
19,043
22,837
19.5
19.9
835.4
1,019.0
34.2
28.1
12.8
9.9
40.9
37.8
4.0
3.3
Gabriel India
Neutral
189
-
2,711
1,782
2,033
9.7
10.2
7.1
8.9
26.6
21.3
5.4
4.5
21.0
22.2
1.5
1.3
Hero Motocorp
Buy
3,445
4,129
68,798
32,239
36,878
16.0
15.6
184.4
206.5
18.7
16.7
5.9
5.1
31.3
30.7
1.9
1.6
Jamna Auto Industries Neutral
64
-
2,558
1,441
1,662
14.4
14.8
13.9
17.6
4.6
3.7
1.3
1.0
30.0
31.0
1.8
1.5
Mahindra and Mahindra Neutral
1,419
-
88,220
46,971
53,816
13.6
14.0
67.7
79.8
21.0
17.8
3.0
2.7
15.0
15.9
1.8
1.5
Maruti
Accumulate
9,143
9,674
276,184
79,470
95,208
15.9
17.2
281.7
363.8
32.5
25.1
7.1
5.7
21.7
22.8
3.1
2.5
Minda Industries
Neutral
1,127
-
9,741
4,328
5,084
11.0
11.9
27.3
36.4
41.4
31.0
8.8
6.9
23.1
25.6
2.3
2.0
Motherson Sumi
Neutral
377
-
79,302
55,937
64,445
10.8
11.4
16.9
21.1
22.3
17.9
5.0
5.1
25.2
25.4
1.5
1.2
Tata Motors
Neutral
406
-
117,140
303,167
343,649
11.8
13.8
33.1
54.7
12.3
7.4
2.0
1.6
16.9
23.0
0.4
0.4
TVS Motor
Neutral
760
-
36,107
13,992
16,216
9.0
9.4
17.1
20.3
44.6
37.4
11.8
9.2
29.7
27.7
2.5
2.1
Amara Raja Batteries
Accumulate
771
858
13,166
6,140
7,122
14.3
15.6
29.3
39.0
26.3
19.8
4.5
3.8
17.1
19.0
2.2
1.8
Exide Industries
Neutral
205
-
17,383
8,689
9,854
15.1
15.2
9.7
11.0
21.2
18.6
3.8
3.3
15.7
16.1
1.7
1.5
Apollo Tyres
Neutral
244
-
13,972
15,739
17,326
13.3
14.6
20.4
26.7
12.0
9.2
1.5
1.3
20.4
26.7
1.1
1.0
Ceat
Neutral
1,733
-
7,012
6,661
7,717
11.1
14.2
116.2
178.2
14.9
9.7
2.6
2.2
15.2
21.3
1.2
1.0
JK Tyres
Neutral
136
-
3,093
8,318
9,239
16.2
16.4
21.0
27.5
6.5
5.0
1.3
1.0
19.1
20.4
0.8
0.7
Swaraj Engines
Neutral
1,951
-
2,423
788
889
16.4
16.5
71.6
81.0
27.3
24.1
7.9
7.3
29.6
31.0
2.7
2.4
Subros
Neutral
258
-
1,547
1,855
2,135
11.6
11.8
10.3
14.7
25.2
17.6
3.8
3.3
15.8
19.1
1.0
0.9
Capital Goods
BEML
Neutral
1,562
-
6,504
4,286
5,194
7.1
8.2
42.9
58.1
36.4
26.9
3.0
2.7
7.6
8.7
1.6
1.3
Bharat Electronics
Neutral
181
-
44,558
10,258
12,470
19.6
19.5
7.3
8.6
24.8
21.1
0.5
0.4
20.4
21.9
3.8
3.1
Voltas
Neutral
628
-
20,768
6,778
8,004
9.6
11.0
17.1
22.4
36.7
28.0
8.8
7.7
17.7
19.8
2.8
2.3
BHEL
Neutral
92
-
33,630
33,200
39,167
6.8
9.5
6.2
11.2
14.8
8.2
0.7
0.7
4.6
8.0
0.6
0.4
Blue Star
Accumulate
803
867
7,695
5,220
6,207
6.3
6.6
16.8
22.3
47.8
36.0
9.5
8.4
19.9
23.3
1.4
1.2
CG Power and Industrial
Neutral
87
-
5,434
6,555
7,292
7.5
7.5
-
0.8
8,670.0
108.4
1.3
1.4
0.1
1.2
0.9
0.8
Solutions
Greaves Cotton
Neutral
119
-
2,909
1,778
1,993
14.7
15.1
8.1
9.1
14.7
13.1
3.3
3.1
21.8
23.6
1.4
1.2
Stock Watch
December 13, 2017
Company Name
Reco
CMP
Target
Mkt Cap
Sales ( Čcr )
OPM(%)
EPS (Č)
PER(x)
P/BV(x)
RoE(%)
EV/Sales(x)
(Č)
Price ( Č)
( Č cr )
FY18E FY19E
FY18E
FY19E
FY18E
FY19E
FY18E
FY19E
FY18E
FY19E
FY18E
FY19E
FY18E
FY19E
Capital Goods
KEC International
Neutral
334
-
8,598
9,779
11,113
9.4
9.8
14.2
18.2
23.6
18.4
4.5
3.7
21.1
22.1
1.1
1.0
KEI Industries
Accumulate
394
436
3,084
3,001
3,391
10.0
10.0
13.0
16.1
30.3
24.4
5.5
4.6
18.2
18.7
1.2
1.1
Thermax
Neutral
1,183
-
14,094
4,125
4,747
10.3
10.8
26.7
31.5
44.3
37.6
5.0
4.5
11.2
12.0
3.1
2.7
VATech Wabag
Accumulate
615
681
3,355
3,867
4,126
9.6
10.0
34.9
39.8
17.6
15.4
2.9
2.5
17.7
17.5
0.9
0.8
Cement
ACC
Neutral
1,709
-
32,098
12,255
13,350
13.5
14.3
58.0
66.2
29.5
25.8
3.5
3.3
11.5
12.2
2.6
2.4
Ambuja Cements
Neutral
265
-
52,689
10,250
11,450
17.5
19.0
7.2
8.3
36.9
32.0
2.6
2.5
7.0
7.8
4.9
4.3
India Cements
Neutral
169
-
5,206
6,135
6,750
14.8
15.2
8.5
11.5
19.9
14.7
1.0
0.9
4.8
6.2
1.2
1.0
JK Cement
Neutral
990
-
6,919
4,150
4,775
19.2
20.0
49.0
63.5
20.2
15.6
3.2
2.8
17.0
18.5
2.1
1.8
J K Lakshmi Cement
Neutral
412
-
4,845
3,422
3,757
15.5
17.0
13.5
23.2
30.5
17.8
3.2
2.7
10.8
15.5
1.8
1.6
Orient Cement
Neutral
166
-
3,391
2,215
3,233
16.8
17.0
5.9
6.9
28.1
24.0
2.1
2.0
10.8
10.1
2.5
1.7
UltraTech Cement
Neutral
4,226
-
116,015
28,250
35,150
20.2
23.5
77.5
122.2
54.5
34.6
4.6
4.2
9.6
14.8
4.6
3.7
Construction
KNR Constructions
Neutral
275
-
3,865
1,846
2,203
14.5
14.5
12.1
13.7
22.7
20.1
1.2
1.1
17.5
16.7
2.1
1.8
Larsen & Toubro
Neutral
1,203
-
168,523
95,787
109,476
10.2
11.6
44.5
50.8
27.1
23.7
3.4
3.1
12.9
13.1
2.3
2.0
Gujarat Pipavav Port
Neutral
141
-
6,833
739
842
61.6
62.7
5.1
6.2
27.7
23.0
3.5
3.4
12.7
14.9
8.7
7.5
PNC Infratech
Neutral
186
-
4,761
2,040
2,935
13.0
13.0
6.4
9.0
29.0
20.6
0.8
0.7
9.7
12.2
2.3
1.7
Simplex Infra
Neutral
565
-
2,793
6,012
6,619
11.6
11.7
21.1
31.0
26.8
18.2
1.9
1.7
6.5
8.6
1.0
0.9
Sadbhav Engineering
Neutral
367
-
6,297
3,823
4,426
10.7
10.8
10.3
11.8
35.6
31.1
4.3
3.7
10.1
10.5
2.0
1.7
NBCC
Neutral
251
-
22,622
9,099
12,706
6.4
6.4
7.3
9.6
34.5
26.3
1.5
1.2
27.5
30.5
2.3
1.7
MEP Infra
Neutral
93
-
1,513
2,403
2,910
18.3
16.8
2.4
6.1
39.6
15.3
15.0
10.1
35.2
55.8
1.8
1.5
SIPL
Neutral
142
-
5,010
2,060
2,390
46.8
47.7
(5.8)
(3.1)
5.3
6.1
(14.2)
(2.3)
7.2
6.7
Engineers India
Neutral
190
-
12,834
1,795
2,611
21.1
22.4
5.9
8.1
32.3
23.5
2.3
2.2
12.9
16.1
5.5
3.6
Financials
Axis Bank
Accumulate
538
580
129,107
32,558
35,843
3.5
3.2
27.8
41.0
19.4
13.1
2.1
1.8
11.4
14.9
-
-
Bank of Baroda
Neutral
166
-
38,134
22,533
26,079
2.4
2.4
12.0
20.9
13.8
7.9
0.9
0.9
6.6
11.0
-
-
Canara Bank
Neutral
367
-
21,915
17,925
20,235
2.0
2.1
18.5
36.5
19.8
10.1
0.8
0.7
3.4
6.2
-
-
Can Fin Homes
Neutral
467
-
6,210
586
741
3.5
3.5
107.8
141.0
4.3
3.3
1.0
0.8
24.1
25.6
-
-
Cholamandalam Inv. &
Neutral
1,276
-
19,939
2,826
3,307
6.3
6.3
53.7
64.6
23.8
19.8
4.1
3.5
18.3
18.9
-
-
Fin. Co.
Dewan Housing Finance Buy
582
712
18,253
2,676
3,383
2.4
2.7
37.4
49.7
15.6
11.7
2.0
1.8
13.8
16.2
-
-
Equitas Holdings
Buy
139
235
4,720
1,125
1,380
9.6
9.8
1.5
6.0
92.7
23.2
2.1
2.0
2.4
8.2
-
-
Federal Bank
Buy
107
125
20,955
4,896
5,930
2.8
3.1
5.4
7.6
19.9
14.1
1.7
1.6
8.5
11.0
-
-
Stock Watch
December 13, 2017
Company Name
Reco
CMP
Target
Mkt Cap
Sales ( Čcr )
OPM(%)
EPS (Č)
PER(x)
P/BV(x)
RoE(%)
EV/Sales(x)
(Č)
Price ( Č)
( Č cr )
FY18E FY19E
FY18E
FY19E
FY18E
FY19E
FY18E
FY19E
FY18E
FY19E
FY18E
FY19E
FY18E
FY19E
Financials
GIC Housing
Buy
409
655
2,204
376
477
3.6
3.7
33.0
40.0
12.4
10.2
2.2
1.9
20.0
23.0
-
-
HDFC Bank
Neutral
1,824
-
472,076
55,236
63,253
4.5
4.4
68.9
82.4
26.5
22.1
4.6
3.8
18.7
18.5
-
-
ICICI Bank
Neutral
307
-
197,389
42,361
51,378
3.6
3.9
18.4
25.7
16.7
12.0
1.8
1.8
11.3
15.0
-
-
Karur Vysya Bank
Buy
116
180
8,403
3,289
3,630
3.7
3.9
10.8
14.1
10.8
8.3
1.3
1.2
12.5
14.7
-
-
LIC Housing Finance
Accumulate
551
630
27,830
4,895
6,332
3.4
3.7
50.7
66.8
10.9
8.3
2.2
1.8
21.7
23.8
-
-
Punjab Natl.Bank
Neutral
174
-
36,931
23,708
25,758
2.1
2.1
5.9
16.4
29.5
10.6
0.9
0.8
3.0
8.3
-
-
RBL Bank
Neutral
511
-
21,278
2,309
2,888
2.6
2.5
16.4
19.1
31.2
26.8
3.9
3.5
13.3
13.8
-
-
Repco Home Finance
Buy
641
825
4,009
496
597
4.4
4.2
38.5
48.7
16.7
13.2
3.0
2.5
19.6
20.6
-
-
South Ind.Bank
Neutral
32
-
5,706
3,195
3,567
3.0
3.1
3.0
3.8
10.5
8.3
1.0
0.9
10.5
11.9
-
-
St Bk of India
Neutral
318
-
274,845
105,827
121,056
2.4
2.5
16.1
25.6
19.8
12.5
1.6
1.4
6.6
9.9
-
-
Union Bank
Neutral
151
-
10,973
14,650
16,225
2.3
2.3
23.1
32.5
6.5
4.7
0.5
0.5
7.1
9.2
-
-
Yes Bank
Neutral
307
-
70,422
11,088
13,138
3.0
2.9
84.0
99.3
3.7
3.1
0.6
0.5
16.3
16.8
-
-
FMCG
Akzo Nobel India
Neutral
1,818
-
8,720
3,164
3,607
13.8
13.7
58.6
67.9
31.0
26.8
7.6
6.7
24.5
25.1
2.6
2.3
Asian Paints
Neutral
1,119
-
107,286
17,603
20,615
18.6
18.6
2,128.9
2,543.3
0.5
0.4
11.1
9.3
28.0
28.9
5.9
5.0
Britannia
Neutral
4,859
-
58,341
9,690
11,278
14.8
15.4
84.0
101.0
57.9
48.1
21.1
16.8
40.6
39.0
6.0
5.1
Colgate
Neutral
1,069
-
29,075
4,420
5,074
24.9
25.3
28.6
32.8
37.4
32.6
14.7
11.9
43.8
40.5
6.3
5.5
Dabur India
Neutral
348
-
61,283
8,346
9,344
19.6
19.9
7.8
9.0
44.6
38.7
9.0
8.1
25.2
24.8
6.9
6.1
GlaxoSmith Con*
Neutral
6,261
-
26,330
5,072
5,760
18.2
18.4
176.3
199.2
35.5
31.4
7.5
6.8
21.2
21.7
4.5
3.9
Godrej Consumer
Neutral
1,010
-
68,804
10,171
11,682
20.8
21.5
21.7
27.1
46.5
37.3
10.5
9.0
22.3
23.4
6.9
5.9
HUL
Neutral
1,315
-
284,618
37,077
41,508
20.3
21.8
5,189.9
6,318.5
0.3
0.2
40.1
34.2
74.8
82.0
7.5
6.7
ITC
Neutral
262
-
318,783
44,588
49,853
37.0
37.3
9.6
11.0
27.2
23.8
6.7
6.4
25.1
27.3
6.6
5.9
Marico
Neutral
308
-
39,762
6,788
7,766
18.5
19.2
7.1
8.5
43.4
36.2
15.2
13.0
36.9
38.0
5.7
5.0
Nestle*
Neutral
7,911
-
76,274
10,083
11,182
20.0
20.9
119.7
141.3
66.1
56.0
232.9
212.9
36.7
39.8
7.2
6.5
Tata Global
Neutral
288
-
18,164
7,121
7,641
11.9
12.3
6.9
8.0
41.7
36.0
2.8
2.7
6.8
7.2
2.4
2.2
Procter & Gamble
Neutral
9,515
-
30,886
3,034
3,579
27.1
27.7
167.7
198.8
56.7
47.9
15.2
13.1
28.8
29.5
9.6
8.1
Hygiene
IT
HCL Tech^
Buy
873
1,014
124,576
50,009
54,608
22.1
22.1
62.8
67.6
13.9
12.9
3.1
2.7
22.4
20.6
2.2
1.9
Infosys
Accumulate
1,011
1,120
232,249
70,333
75,960
26.0
26.0
61.7
65.9
16.4
15.3
3.1
2.9
18.9
18.7
2.7
2.4
TCS
Reduce
2,614
2,442
500,424
123,384
134,488
26.1
26.1
133.2
143.7
19.6
18.2
5.4
5.1
27.6
27.8
3.7
3.4
Tech Mahindra
Accumulate
501
526
48,894
30,545
32,988
15.0
15.0
35.2
37.6
14.2
13.3
2.4
2.3
16.8
16.2
1.4
1.2
Stock Watch
December 13, 2017
Company Name
Reco
CMP
Target
Mkt Cap
Sales ( Čcr )
OPM(%)
EPS (Č)
PER(x)
P/BV(x)
RoE(%)
EV/Sales(x)
(Č)
Price ( Č)
( Č cr )
FY18E FY19E
FY18E
FY19E
FY18E
FY19E
FY18E
FY19E
FY18E
FY19E
FY18E
FY19E
FY18E
FY19E
IT
Wipro
Neutral
287
-
139,771
54,164
56,544
22.3
22.3
18.8
19.5
15.3
14.7
2.4
2.1
15.0
13.6
1.8
1.6
Media
D B Corp
Neutral
351
-
6,455
2,404
2,625
30.5
31.5
23.7
26.9
14.8
13.0
3.5
3.0
23.5
22.8
2.5
2.3
HT Media
Neutral
97
-
2,266
2,589
2,830
15.1
15.4
8.3
10.9
11.7
8.9
1.0
0.9
8.4
10.4
0.4
0.3
Jagran Prakashan
Buy
166
225
5,174
2,541
2,835
28.5
28.7
12.7
14.1
13.1
11.8
2.7
2.4
21.3
21.4
1.9
1.6
Sun TV Network
Neutral
890
-
35,085
3,238
3,789
51.9
55.1
30.9
38.0
28.8
23.4
8.2
7.2
30.0
31.0
10.3
8.7
Hindustan Media
Neutral
237
-
1,736
1,002
1,074
23.3
23.5
29.2
33.8
8.1
7.0
1.3
1.1
15.6
15.4
0.7
0.5
Ventures
TV Today Network
Accumulate
398
435
2,373
667
727
27.7
27.7
18.6
20.1
21.4
19.8
3.3
3.4
15.6
17.3
3.1
2.9
Music Broadcast Limited Accumulate
385
434
2,196
271
317
91.0
109.0
6.0
10.0
64.2
38.5
4.0
3.6
6.5
9.3
7.7
6.3
Metals & Mining
Coal India
Neutral
263
-
163,410
82,301
91,235
17.0
18.0
17.1
20.5
15.4
12.8
2.9
2.7
45.0
55.0
1.7
1.5
Hind. Zinc
Neutral
291
-
122,809
22,108
24,555
57.0
58.0
22.1
26.3
13.2
11.1
4.3
3.5
32.0
35.0
4.6
3.8
Hindalco
Neutral
237
-
53,235
102,350
105,355
13.5
14.5
21.5
24.5
11.0
9.7
1.5
1.3
15.0
15.2
1.1
1.0
JSW Steel
Neutral
250
-
60,503
64,500
68,245
21.1
21.5
20.1
21.2
12.5
11.8
2.3
2.0
-
-
1.7
1.6
NMDC
Neutral
130
-
41,146
10,209
11,450
47.0
48.0
11.1
12.1
11.7
10.8
1.6
1.5
-
-
3.5
3.2
SAIL
Neutral
80
-
33,103
54,100
63,555
3.0
10.0
(10.0)
1.5
53.4
1.1
1.1
-
-
1.6
1.4
Vedanta
Neutral
293
-
108,970
81,206
87,345
28.0
29.0
26.5
33.5
11.1
8.8
2.5
2.2
-
-
2.1
1.8
Tata Steel
Neutral
689
-
66,936
121,445
126,500
16.2
17.2
65.4
81.3
10.5
8.5
1.7
1.4
-
-
1.1
0.9
Oil & Gas
GAIL
Neutral
492
-
83,204
53,115
52,344
14.2
15.3
30.0
31.1
16.4
15.8
2.1
1.9
-
-
1.3
1.3
ONGC
Neutral
183
-
234,784
83,111
84,934
44.2
44.9
16.4
16.9
11.2
10.8
1.4
1.3
-
-
2.7
2.7
Indian Oil Corp
Neutral
395
-
191,857
396,116
432,560
8.5
8.8
40.1
42.2
9.9
9.4
1.7
1.5
-
-
0.6
0.6
Reliance Industries
Neutral
915
-
595,130
257,711
267,438
17.0
18.2
89.1
89.5
10.3
10.2
1.0
0.9
-
-
2.0
1.9
Pharmaceuticals
Alembic Pharma
Accumulate
523
600
9,864
3,346
3,915
19.6
19.2
21.0
23.9
24.9
21.9
4.4
3.7
19.1
18.4
2.9
2.6
Alkem Laboratories Ltd
Accumulate
2,091
2,341
25,002
6,320
7,341
17.5
19.8
72.7
96.6
28.8
21.7
5.1
4.3
16.7
18.7
3.9
3.3
Aurobindo Pharma
Buy
677
823
39,679
17,086
19,478
22.1
22.0
44.7
51.4
15.2
13.2
3.4
2.7
24.7
22.7
2.4
2.1
Aventis*
Neutral
4,639
-
10,683
2,411
2,698
18.8
18.8
151.6
163.9
30.6
28.3
4.8
3.8
25.4
27.5
4.0
3.4
Cadila Healthcare
Neutral
415
-
42,475
11,365
12,926
20.0
20.0
18.4
20.5
22.6
20.2
5.0
4.1
24.3
22.2
3.8
3.3
Cipla
Sell
591
462
47,545
16,163
18,711
16.6
16.9
20.7
24.3
28.5
24.3
3.4
3.0
12.6
13.1
3.1
2.6
Dr Reddy's
Reduce
2,256
2,040
37,403
13,734
15,548
17.7
20.2
69.9
102.0
32.3
22.1
2.9
2.6
9.2
12.4
3.0
2.6
GSK Pharma*
Sell
2,443
2,000
20,693
2,968
3,324
13.8
15.9
37.8
46.3
64.6
52.8
11.3
12.4
16.7
22.4
6.8
6.2
Indoco Remedies
Sell
271
136
2,496
1,114
1,297
9.9
13.9
5.6
11.4
48.4
23.8
3.7
3.3
7.7
14.5
2.5
2.1
Stock Watch
December 13, 2017
Company Name
Reco
CMP
Target
Mkt Cap
Sales ( Čcr )
OPM(%)
EPS (Č)
PER(x)
P/BV(x)
RoE(%)
EV/Sales(x)
(Č)
Price ( Č)
( Č cr )
FY18E FY19E
FY18E
FY19E
FY18E
FY19E
FY18E
FY19E
FY18E
FY19E
FY18E
FY19E
FY18E
FY19E
Pharmaceuticals
Ipca labs
Neutral
552
-
6,962
3,256
3,647
14.1
17.1
16.2
25.4
34.1
21.7
2.6
2.4
8.0
11.5
2.2
2.0
Lupin
Buy
845
1,091
38,191
16,240
18,562
21.3
21.7
42.5
49.6
19.9
17.0
2.5
2.2
13.3
13.7
2.5
2.1
Natco Pharma
Accumulate
961
1,057
16,764
1,886
2,016
32.3
29.5
23.2
22.0
41.5
43.6
8.7
7.7
20.9
17.6
8.7
8.2
Sun Pharma
Buy
521
615
124,953
28,312
31,826
20.7
22.4
18.5
22.3
28.2
23.4
3.2
2.9
11.5
14.0
4.0
3.5
Syngene International
Accumulate
537
587
10,740
1,394
1,818
33.0
36.5
15.8
21.0
33.9
25.6
6.3
5.2
18.6
20.3
7.7
5.9
Power
Tata Power
Neutral
91
-
24,492
32,547
33,806
20.5
20.5
4.7
5.4
19.3
16.9
1.8
1.6
10.5
10.5
1.7
1.7
NTPC
Neutral
176
-
144,955
86,070
101,246
28.3
30.7
12.9
16.2
13.6
10.9
1.4
1.3
10.6
12.4
3.0
2.7
Power Grid
Accumulate
203
223
106,201
29,183
32,946
89.7
90.0
18.0
20.8
11.3
9.8
1.9
1.7
17.7
18.2
7.6
7.0
Real Estate
Prestige Estate
Neutral
296
-
11,113
4,607
5,146
21.0
22.2
7.9
9.8
37.5
30.2
2.3
2.1
10.3
12.0
3.6
3.3
MLIFE
Buy
449
522
2,306
487
590
12.3
17.8
21.0
31.2
21.4
14.4
1.1
1.1
5.2
7.4
3.5
2.8
Telecom
Bharti Airtel
Neutral
524
-
209,444
97,903
105,233
36.0
36.3
9.3
11.1
56.3
47.4
2.7
2.6
5.0
5.6
3.1
2.8
Idea Cellular
Neutral
93
-
33,693
35,012
37,689
27.1
27.7
(4.4)
(2.7)
1.5
1.5
(6.8)
(4.6)
2.3
2.0
zOthers
Abbott India
Neutral
5,457
-
11,596
3,244
3,723
14.9
16.1
167.5
209.4
32.6
26.1
7.2
6.0
23.7
24.8
3.2
2.7
Asian Granito
Accumulate
513
570
1,542
1,169
1,286
12.5
12.5
16.0
19.7
32.1
26.0
3.4
3.0
10.7
11.6
1.6
1.4
Bajaj Electricals
Neutral
481
-
4,887
4,646
5,301
6.7
7.6
16.1
22.3
29.9
21.6
4.9
4.2
16.4
19.2
1.0
0.9
Banco Products (India)
Neutral
249
-
1,781
1,530
1,695
13.2
12.7
19.0
20.0
13.1
12.5
2.1
1.9
0.2
0.2
1.1
120.0
Coffee Day Enterprises
Neutral
275
-
5,658
3,494
3,913
17.4
18.0
4.8
5.7
-
48.2
2.4
2.3
-
0.1
2.1
1.8
Ltd
Elecon Engineering
Neutral
95
-
1,064
171
201
15.0
16.2
36.0
43.0
2.6
2.2
0.2
0.2
0.1
0.1
5.6
4.7
Garware Wall Ropes
Neutral
913
-
1,998
928
1,003
15.2
15.2
39.4
43.2
23.2
21.2
3.8
3.3
16.5
15.4
2.0
1.8
Goodyear India*
Neutral
869
-
2,005
1,717
1,866
11.8
12.3
47.9
49.8
18.1
17.5
2.8
2.4
15.6
15.7
0.9
123.6
Hitachi
Neutral
2,525
-
6,866
2,355
2,715
10.3
10.8
49.0
60.9
51.5
41.5
12.1
9.5
0.2
0.2
2.9
2.5
HSIL
Neutral
488
-
3,527
2,240
2,670
14.6
15.0
17.0
22.0
28.7
22.2
2.4
2.2
0.1
0.1
1.8
1.5
Interglobe Aviation
Neutral
1,180
-
45,359
22,570
27,955
14.2
15.0
63.6
81.8
18.6
14.4
9.8
8.3
0.5
0.6
1.7
1.3
Jyothy Laboratories
Neutral
370
-
6,725
1,781
2,044
14.1
15.0
9.4
10.5
39.6
35.2
8.4
7.9
0.2
0.2
4.0
3.4
Linc Pen & Plastics
Neutral
366
-
541
420
462
9.3
9.3
15.3
17.1
23.9
21.4
4.0
4.2
16.9
19.5
1.3
1.2
M M Forgings
Neutral
1,007
-
1,216
542
642
20.1
21.0
41.6
56.8
24.2
17.7
3.3
2.8
0.1
0.2
2.7
2.3
Mirza International
Neutral
157
-
1,885
1,148
1,285
18.0
18.0
8.0
9.4
19.5
16.8
3.2
2.7
16.3
16.1
1.8
1.6
Navkar Corporation
Buy
191
265
2,876
561
617
41.5
41.5
11.5
12.7
16.6
15.0
1.8
1.6
10.5
10.4
5.8
5.1
Nilkamal
Neutral
1,802
-
2,689
2,317
2,525
11.4
11.1
96.0
105.0
18.8
17.2
3.2
2.8
0.2
0.2
1.1
1.0
Stock Watch
December 13, 2017
Company Name
Reco
CMP
Target Mkt Cap
Sales ( Čcr )
OPM(%)
EPS (Č)
PER(x)
P/BV(x)
RoE(%)
EV/Sales(x)
(Č)
Price ( Č)
( Č cr )
FY18E FY19E FY18E FY19E FY18E FY19E FY18E FY19E FY18E FY19E FY18E FY19E FY18E FY19E
zOthers
Parag Milk Foods
Neutral
260
-
2,186
1,987
2,379
7.6
9.0
12.4
18.3
21.0
14.2
3.0
2.6
8.2
13.2
1.2
1.0
Radico Khaitan
Neutral
271
-
3,607
1,811
1,992
13.2
13.2
8.1
8.8
33.4
30.8
3.4
3.7
10.1
12.0
2.3
2.1
Relaxo Footwears
Neutral
640
-
7,702
1,981
2,310
13.7
14.5
12.0
15.5
53.3
41.3
10.4
8.4
0.2
0.2
4.0
3.4
Siyaram Silk Mills
Accumulate
751
800
3,518
1,769
1,981
12.7
12.7
22.6
26.2
33.2
28.6
5.1
4.4
15.5
15.5
2.2
1.9
Styrolution ABS India* Neutral
1,051
-
1,848
1,800
1,980
8.0
8.1
42.0
46.2
25.0
22.8
2.8
2.5
0.1
0.1
1.1
1.1
Surya Roshni
Neutral
380
-
1,665
4,870
5,320
7.7
7.8
22.8
28.1
16.7
13.5
2.2
1.9
0.1
0.1
0.6
0.5
TVS Srichakra
Neutral
3,397
-
2,601
2,729
2,893
12.7
12.5
248.5
265.0
13.7
12.8
3.9
3.2
0.3
0.3
1.0
0.9
Visaka Industries
Neutral
628
-
997
1,104
1,214
12.1
12.6
31.0
37.9
20.3
16.6
2.5
2.2
0.1
0.1
1.1
1.0
VIP Industries
Buy
343
400
4,841
1,450
1,693
10.4
10.5
6.5
7.8
52.3
43.9
11.1
9.7
21.1
22.1
3.3
2.8
Navin Fluorine
Accumulate
695
730
3,430
945
1,154
17.5
17.9
28.7
34.8
24.2
20.0
4.0
3.4
-
-
3.1
2.5
Source: Company, Angel Research; Note: *December year end; #September year end; &October year end; Price as on December 12, 2017
Market Outlook
December 13, 2017
Research Team Tel: 022 - 39357800
DISCLAIMER
Angel Broking Private Limited (hereinafter referred to as “Angel”) is a registered Member of National Stock Exchange of India
Limited,Bombay Stock Exchange Limited and Metropolitan Stock Exchange Limited. It is also registered as a Depository Participant with
CDSL and Portfolio Manager with SEBI. It also has registration with AMFI as a Mutual Fund Distributor. Angel Broking Private Limited is a
registered entity with SEBI for Research Analyst in terms of SEBI (Research Analyst) Regulations, 2014 vide registration number
INH000000164. Angel or its associates has not been debarred/ suspended by SEBI or any other regulatory authority for accessing
/dealing in securities Market. Angel or its associates/analyst has not received any compensation / managed or
co-managed public offering of securities of the company covered by Analyst during the past twelve months.
This document is solely for the personal information of the recipient, and must not be singularly used as the basis of any investment
decision. Nothing in this document should be construed as investment or financial advice. Each recipient of this document should make
such investigations as they deem necessary to arrive at an independent evaluation of an investment in the securities of the companies
referred to in this document (including the merits and risks involved), and should consult their own advisors to determine the merits and
risks of such an investment.
Reports based on technical and derivative analysis center on studying charts of a stock's price movement, outstanding positions and
trading volume, as opposed to focusing on a company's fundamentals and, as such, may not match with a report on a company's
fundamentals. Investors are advised to refer the Fundamental and Technical Research Reports available on our website to evaluate the
contrary view, if any.
The information in this document has been printed on the basis of publicly available information, internal data and other reliable
sources believed to be true, but we do not represent that it is accurate or complete and it should not be relied on as such, as this
document is for general guidance only. Angel Broking Pvt. Limited or any of its affiliates/ group companies shall not be in any way
responsible for any loss or damage that may arise to any person from any inadvertent error in the information contained in this report.
Angel Broking Pvt. Limited has not independently verified all the information contained within this document. Accordingly, we cannot
testify, nor make any representation or warranty, express or implied, to the accuracy, contents or data contained within this document.
While Angel Broking Pvt. Limited endeavors to update on a reasonable basis the information discussed in this material, there may be
regulatory, compliance, or other reasons that prevent us from doing so.
This document is being supplied to you solely for your information, and its contents, information or data may not be reproduced,
redistributed or passed on, directly or indirectly.
Neither Angel Broking Pvt. Limited, nor its directors, employees or affiliates shall be liable for any loss or damage that may arise from
or in connection with the use of this information.